

Footwear is 1 of 4 main exporting goods in the beginning of 2018
According to statistics from the General Department of Customs, footwear exports reached 7.5% growth, earning $ 1.5 billion in the last month of 2017. This result brings total export turnover in 2017 to 14 , $ 75 billion, up nearly 13% over last year. Footwear exports continue to rank 4th in the top 10 export items of Vietnam in 2017.
Specifically, in 2017, footwear exports to the US market reached $ 5.12 billion, up 14%, accounting for 33.9% of the total export turnover of footwear of the country. Meanwhile, footwear exports to China increased 26.3% to $ 1.14 billion, to Germany up 30% to $ 993.8 million, Belgium up 10.2% to $ 908.65 million. up 12.3% to $ 751.3 million. Footwear exports to European countries increased by US $ 4.61 billion, or 11%, accounting for 31.5% of the total footwear export turnover of the country.
According to the Vietnam Association of Leather - Shoes - Handbags, the demand for footwear such as high quality men shoes, women shoes, ... in the market is increasing. The goal is to export footwear from $ 19.5 to $ 20 billion in 2018, a 10% increase over 2017, and a 6% increase in footwear and footwear production. Shoe leather is estimated at 57%. If the target is reached, footwear exports are expected to continue to rank among the top four key export items of Vietnam.
A major challenge facing the footwear industry is the problem of productivity. Accordingly, labor productivity is about 25,000 USD / person / year for large enterprises, this number in medium enterprises is about 18,000 USD / person / year and small and medium enterprises is about 12,000 USD / person / year.
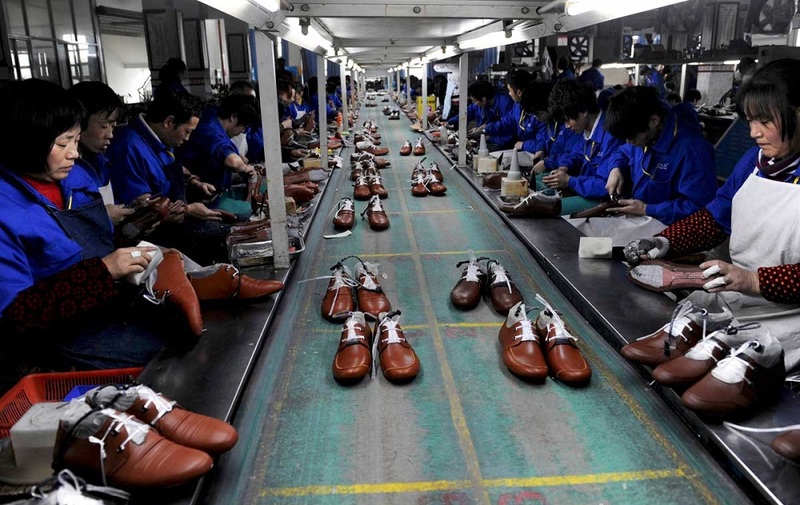
In the year 2018, businesses in the footwear industry will face fierce competition from foreign businesses in Vietnam and in the world. Currently, most of the world's enterprises have applied advanced technology and machinery to production, so labor productivity has improved significantly to 1.2 pairs / hour. Meanwhile, the productivity of Vietnamese enterprises is only half, about 0.6-0.7 pairs / hour.
If the problem of labor productivity is solved, the productivity of the footwear industry is forecasted to increase by 1.5-2 times compared to the present. The application of new techniques and modern machines to the production process will help the company to replace some of the labor, thereby improving the quality of products while controlling the uniformity of output. The investment will be quite expensive, but businesses also need to seriously recognize and invest appropriate to ensure long-term and sustainable development.
Footwear export market in 2017 (USD)
| Exporting Countries | 12/2017 | 12/2017 compared to 11/2017 (%) | 2017 | (+/-%) 2017 compared to 2016 |
| Total of export value | 1.468.234.664 | 7,31 | 14.651.848.923 | 12,72 |
| America | 516.137.793 | 20,02 | 5.113.113.407 | 14,07 |
| China | 101.923.399 | -7,32 | 1.140.655.060 | 26,08 |
| Germany | 97.486.524 | -5,03 | 992.599.683 | 29,86 |
| Belgium | 90.494.407 | -3,64 | 907.502.248 | 9,95 |
| Japan | 78.482.593 | 14,85 | 751.033.319 | 11,3 |
| England | 53.205.164 | -17,94 | 688.813.800 | 11,41 |
| Netherlands | 64.536.233 | 11,75 | 582.864.127 | -2,04 |
| France | 52.298.425 | 2,92 | 511.625.430 | 13,72 |
| Korea | 47.123.088 | 24,14 | 402.717.156 | 16,75 |
| Italia | 35.829.112 | 16,41 | 306.916.894 | -8,58 |
| Canada | 31.317.959 | 7,51 | 292.480.900 | 15,67 |
| Mexico | 26.486.107 | 20,19 | 288.570.412 | 12,35 |
| Spain | 28.425.907 | 13,03 | 258.184.053 | -3,22 |
| Australia | 19.689.381 | -7,51 | 225.352.002 | 7,76 |
| Hong Kong | 16.683.079 | -25,52 | 176.399.003 | 5,73 |
| Brazil | 17.534.485 | 20,93 | 171.275.094 | 8,17 |
| Chile | 6.890.688 | -59,29 | 136.677.740 | 8,97 |
| Taiwan | 13.297.696 | -18,82 | 135.628.140 | 6,49 |
| United Arab Emirates | 10.747.718 | 10,4 | 123.865.248 | -0,65 |
| Panama | 9.882.455 | -1,52 | 116.510.884 | 4,61 |
| South Africa | 9.932.924 | 68,75 | 105.523.014 | -10,15 |
| Russia | 10.254.503 | -0,85 | 102.082.412 | -1,4 |
| Slovakia | 9.146.070 | -5,63 | 97.816.299 | 10,37 |
| Achentina | 11.231.307 | 19,08 | 81.403.657 | 26,68 |
| India | 11.764.377 | 74,45 | 67.906.857 | 47,5 |
| Singapore | 7.321.639 | -0,87 | 67.473.655 | 40,74 |
| Philippines | 5.723.461 | 15,78 | 55.281.550 | 18,95 |
| Sweden | 6.308.254 | 48,34 | 52.612.059 | 21,45 |
| Malaysia | 5.356.563 | -13,91 | 52.142.678 | 0,31 |
| Czech Republic | 8.955.196 | 17,6 | 51.280.497 | 13,3 |
| Thailan | 5.301.469 | 14,99 | 46.928.698 | 14,76 |
| Indonesia | 5.293.415 | 35,92 | 44.808.102 | 49,32 |
| Denmark | 6.769.087 | 84,99 | 44.429.466 | -4,6 |
| Israel | 5.139.812 | 32,67 | 43.464.217 | 17,88 |
| Turkey | 4.038.442 | 10,47 | 34.748.269 | -16,13 |
| Austria | 2.504.038 | -34,02 | 33.535.087 | -2,05 |
| Poland | 3.628.069 | -12,62 | 31.379.372 | 37,24 |
| Greek | 2.463.165 | -8,3 | 30.471.317 | -4,57 |
| New Zealand | 2.817.899 | 1,1 | 28.610.464 | 2,3 |
| Switzerland | 2.282.499 | -20,31 | 20.831.404 | 13,1 |
| Norway | 2.752.797 | 16,38 | 18.440.430 | 16,38 |
| Finland | 2.412.922 | 88,48 | 17.340.848 | 4,95 |
| Ucraina | 566.483 | -52,12 | 7.734.639 | 8,46 |
| Portugal | 896.910 | 77,34 | 3.065.481 | 65,82 |
| Hungary | 289.193 | -13,2 | 1.906.886 | 3,08 |